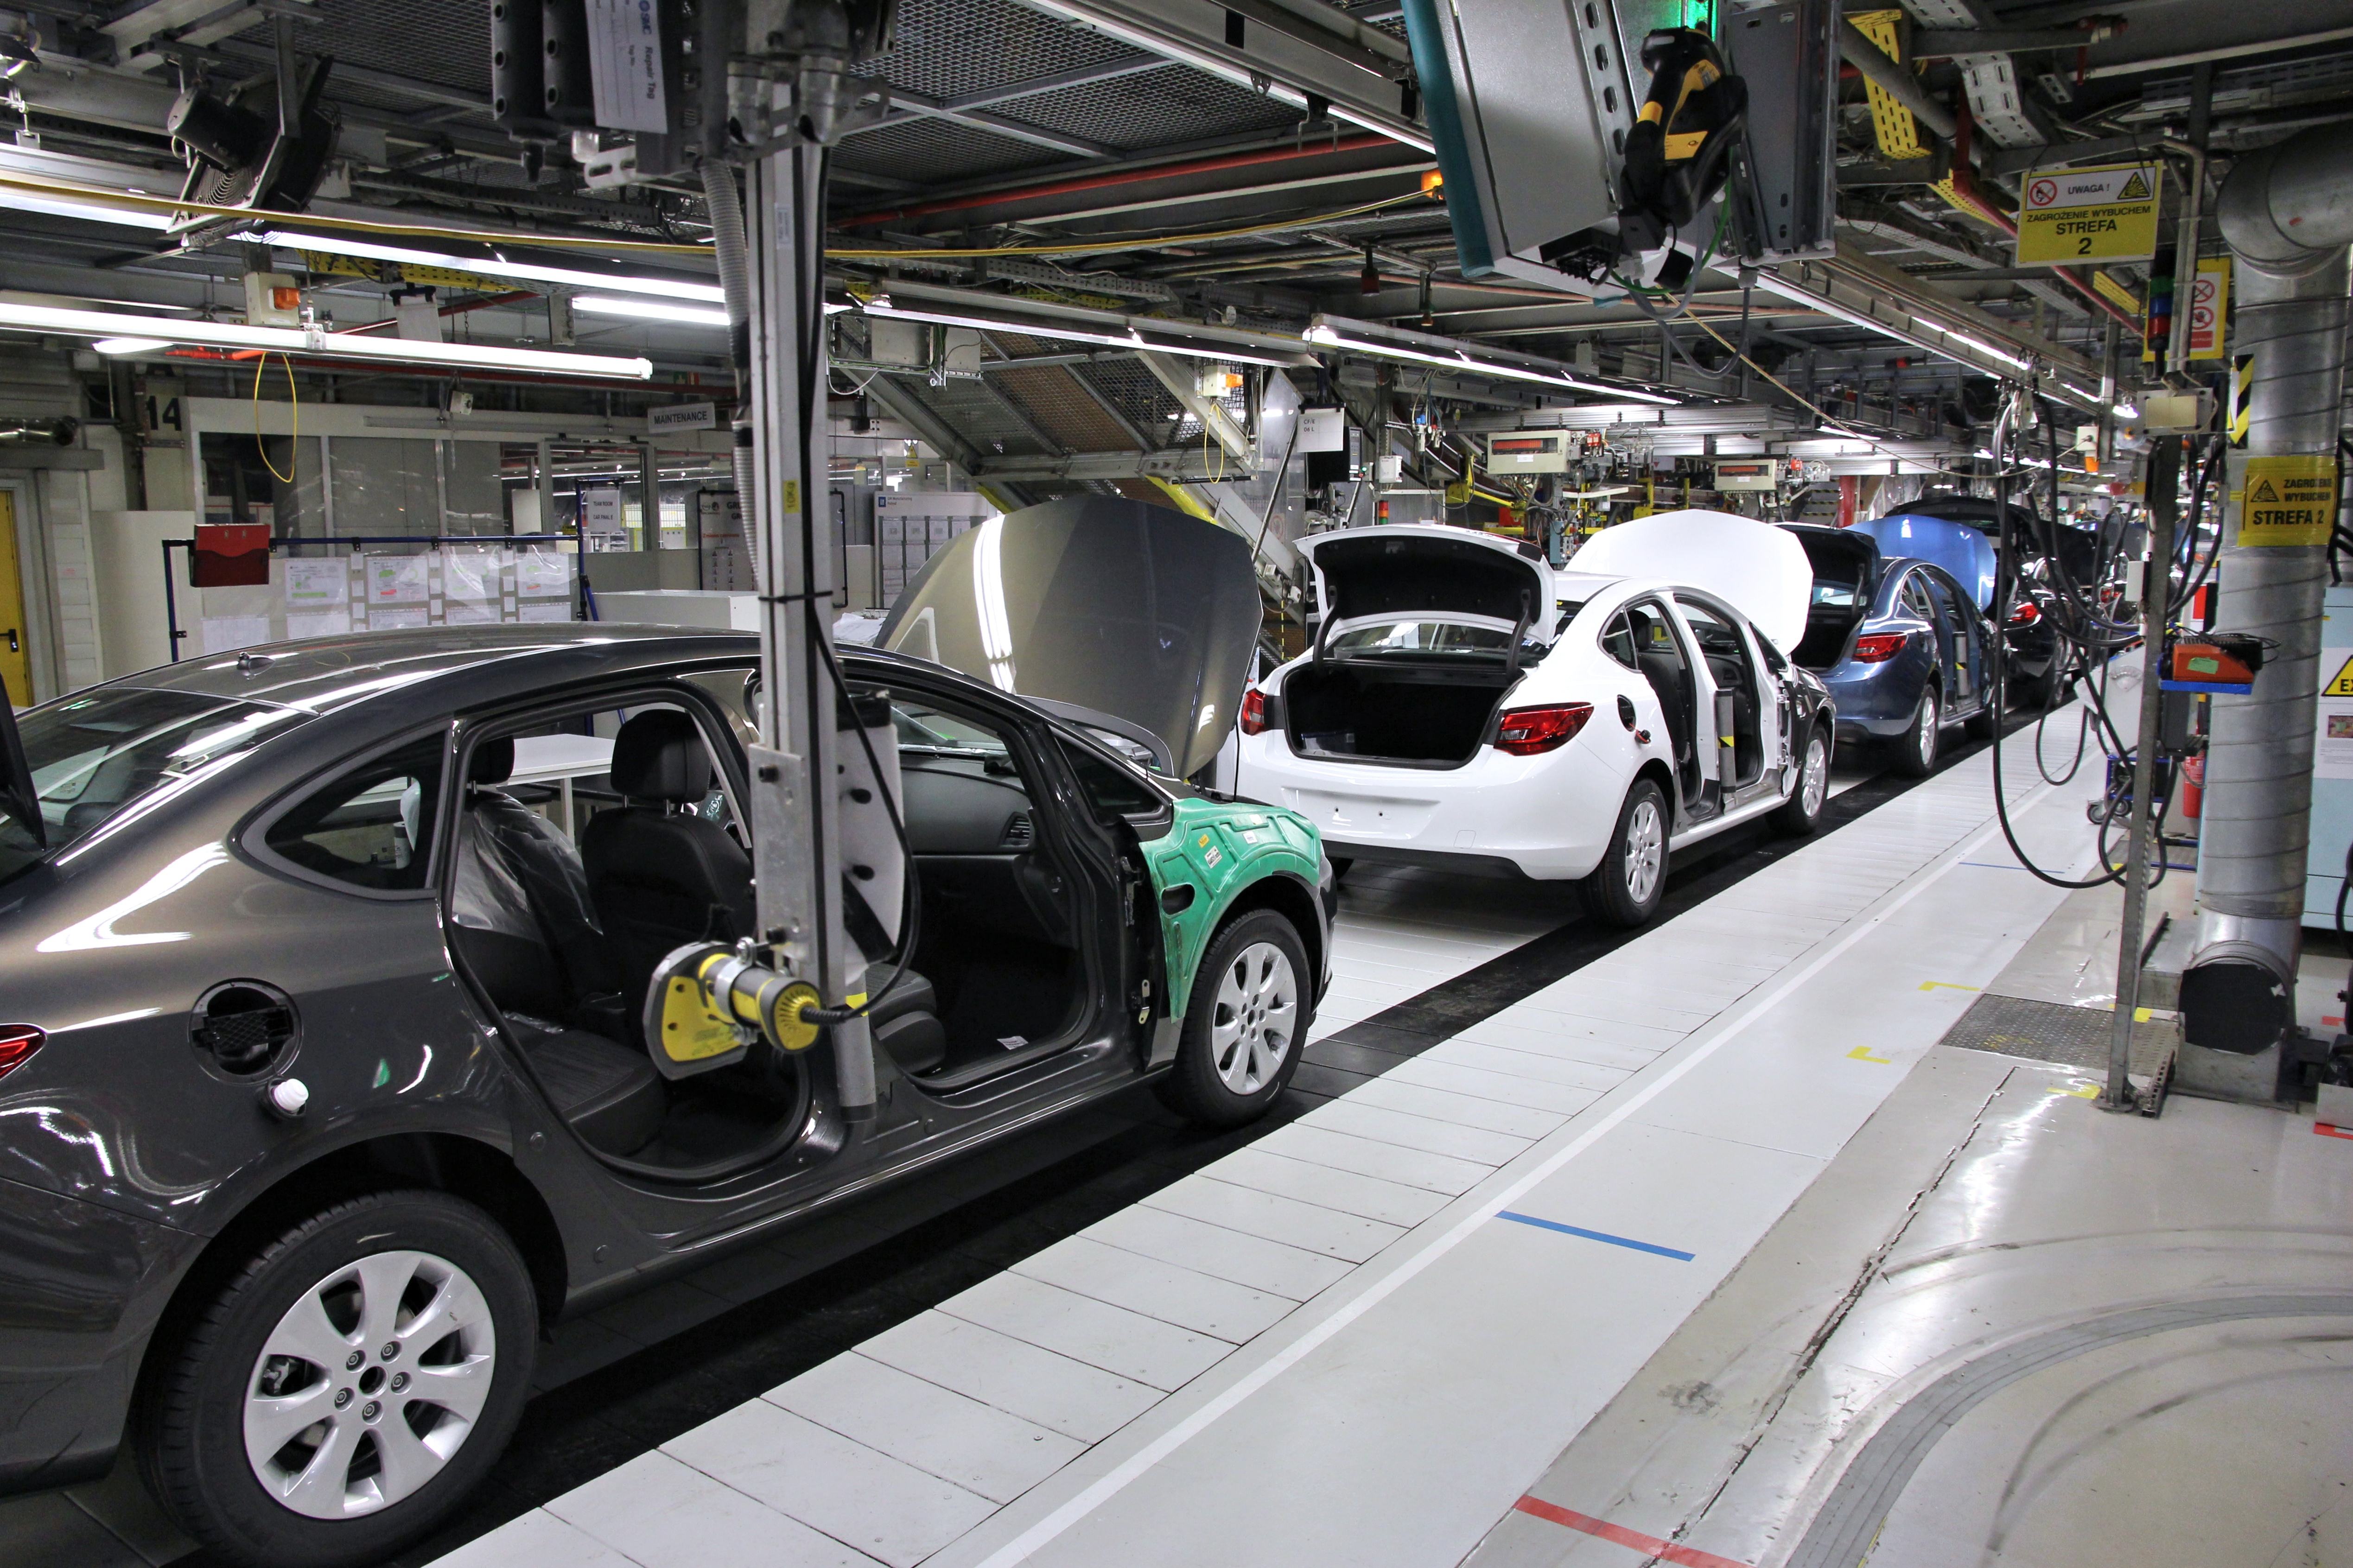
The technology has to earn its place.
A plant manager still has production targets, maintenance issues, quality problems and a budget. Industrial AI matters when it improves those operating realities enough to justify the full cost of adopting it.
NVIDIA’s October 19 discussion of industrial AI in Germany brings fresh attention to robotics and manufacturing. It is a strategic signal, not proof of a return at any particular factory. The business case must be established at the process level.[1]
Predictive models, computer vision, digital twins and humanoid robots solve different problems. A digital twin is not inherently an AI application; the cases below combine simulation, data, automation or AI in different ways. Their results should not be pooled into one “AI productivity” number.
Four cases. Four different tests.
01 / PEPSICO · U.S. PILOTS · JANUARY 2026
Find capacity before buying more.
PepsiCo reported a 20% throughput increase on an initial digital-twin deployment with Siemens and NVIDIA. Its announcement also described 10–15% reductions in capital expenditure from identifying hidden capacity and validating investments virtually. These are company-reported deployment outcomes, not an independently audited, network-wide return.[2]
The operating test: did additional saleable output pass through the actual bottleneck? Extra capacity has financial value only when demand, downstream processes and contribution margins support it. Capex avoidance also needs a documented alternative investment.
02 / P&G · GLOBAL ROLLOUT
Inspect at speed without losing control.
Siemens reports that P&G’s Visual Inspection Cockpit reduces scrap by 10–20%, depending on the product, while inspecting at full line speed. It also reports commissioning five to ten times faster than bespoke vision systems. The release does not provide a matched site-level cost and benefit dataset.[3]
The operating test: lower scrap must not come from accepting defective products. Track false rejects, missed defects, downstream complaints and performance by product variant, alongside inspection coverage. A deployment speed claim is not a payback calculation.
03 / GEORGIA-PACIFIC · RELIABILITY
An alert only matters if someone acts.
An AWS/C3 AI customer case describes monitoring more than 200 major assets and reports up to 5% improvement in overall equipment effectiveness. It does not establish whether that figure is relative or percentage-point improvement, or provide a dated, comparable evaluation window; it should not be restated as five percentage points.[4]
The operating test: connect alerts to work orders, intervention time, confirmed failures and avoided interruption. Data integration and maintenance response are part of the intervention. Recovered hours should be valued at incremental contribution, not gross revenue.
04 / BMW · SPARTANBURG, SOUTH CAROLINA · JUNE 2026
Prove the task before expanding the role.
BMW reported that Figure 02 supported production of more than 30,000 X3 vehicles over ten months in 2025 by placing sheet-metal parts for welding. That is production supported, not vehicles built autonomously. In June 2026, BMW announced a Figure 03 logistics sequencing application; the earlier deployment does not establish the successor’s economics.[5]
The operating test: compare cost per completed task, interventions, availability, quality and ergonomics with realistic alternatives. These include conventional automation, fixtures and process redesign. Public output counts alone do not establish a superior return.
Make the benefit measurable.
| Application | Baseline and outcome | Financial bridge | Guardrail |
|---|---|---|---|
| Predictive maintenance | Unplanned lost hours; alert-to-action time | Recovered saleable production × contribution per hour | False alarms; unnecessary interventions |
| Vision inspection | Scrap, rework and defect escape rates | Material/rework savings; verified avoided claims | False accepts and rejects by product |
| Production planning | Constraint throughput; schedule adherence; OTIF | Incremental contribution; avoided expediting | Inventory growth and downstream congestion |
Use a representative baseline and a comparison line, phased rollout or matched operating periods where feasible. Record changes in demand, staffing, maintenance, materials and product mix. The counterfactual is what would have happened without the intervention, not merely last month’s performance.
Overall equipment effectiveness combines availability, performance and quality. An OEE increase is useful operating evidence, but does not automatically become cash or prove AI caused the improvement.
The full cost belongs in the decision.
Budget for sensors and edge equipment, integration, data preparation, cybersecurity, training, commissioning disruption and contingency. Recurring costs include licenses, compute, model monitoring, maintenance, support and operator review. Establish who owns the system when the vendor’s implementation team leaves.
Separate cash savings, additional contribution, released capacity and avoided capex. Redeployed labor is not a payroll saving unless spending actually falls. Do not count the same recovered production hours once as downtime savings and again as a throughput benefit.
A transparent investment example.
Illustrative model, not a company forecast. Assume $300,000 upfront: $60,000 equipment, $100,000 integration and data, $40,000 training and validation, $50,000 commissioning disruption and $50,000 contingency. Annual running cost is $90,000. Each scenario changes the total annual monetizable benefit; benefits must be incremental and non-overlapping.
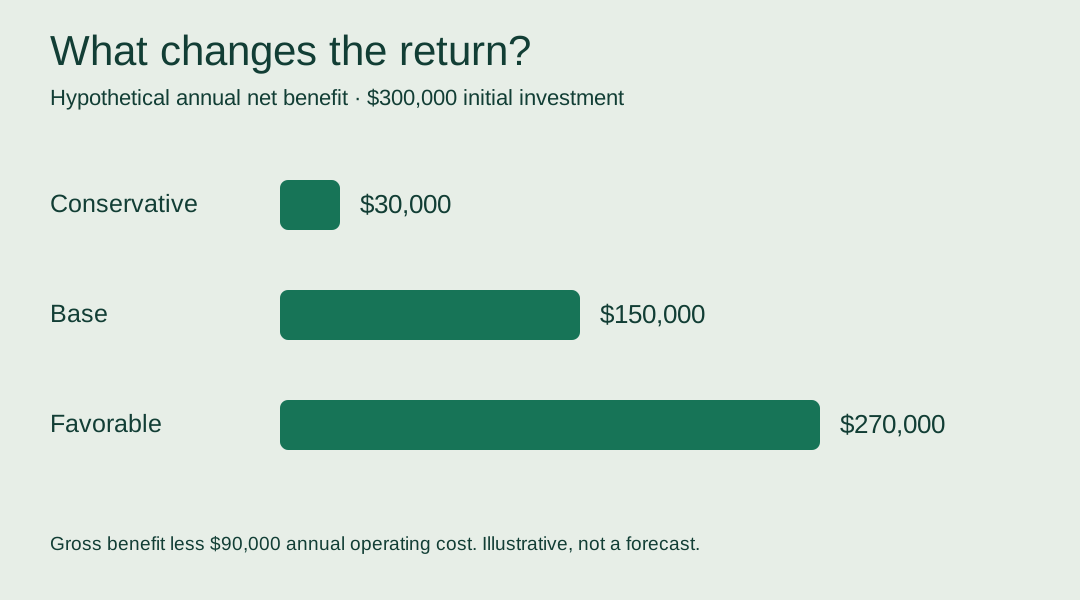
| Scenario | Gross annual benefit | Net annual benefit | Simple payback | 3-year NPV |
|---|---|---|---|---|
| Conservative | $120,000 | $30,000 | 10.0 years | −$225,394 |
| Base | $240,000 | $150,000 | 2.0 years | $73,028 |
| Favorable | $360,000 | $270,000 | 1.1 years | $371,450 |
NPV uses a hypothetical 10% discount rate, initial spending at time zero and three equal year-end net benefits, with no residual value, tax, working capital or ramp-up. Simple payback assumes immediate, steady benefits. Those simplifications can overstate attractiveness; validate a dated cash-flow plan before approval. The approximate annual gross-benefit hurdle for a zero three-year NPV is $210,634.
Three decisions after the pilot.
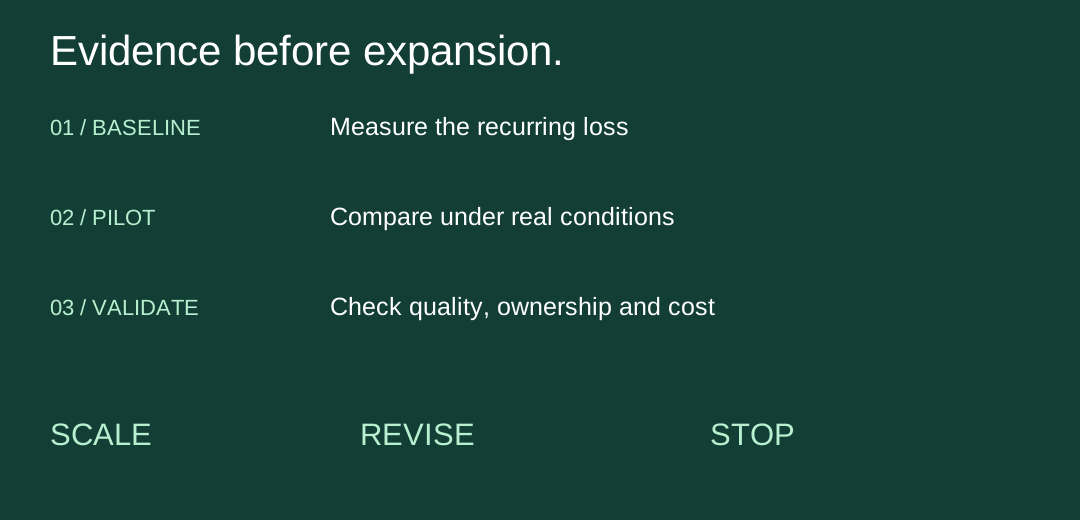
Scale when improvements persist across representative shifts and product mixes, quality and safety guardrails hold, operators can run the workflow and the incremental rollout economics meet the company’s hurdle.
Revise when the signal is promising but alert response, data coverage, integration or training prevents value capture. Give the next test an owner, a budget and a decision date.
Stop when the benefit does not survive a fair comparison, a simpler alternative is better, or the intervention cannot meet operating requirements. Sunk pilot cost is not a reason to fund expansion.
A practical first 90 days might cover baseline and use-case selection, a bounded pilot, then operating and financial review. Rare failures, seasonality or long production cycles may require more time. Ninety days is a planning example, not a universal proof period.
What leadership should ask next.
My first question would be: which recurring loss can this team actually reduce? I would then ask how the result will be measured, who acts on the output, and what evidence would change the investment decision.
The broader opportunity is to build a repeatable capability: connect operating data, test a change, measure the outcome and retain what works. The World Economic Forum’s 2026 Lighthouse report also emphasizes moving from pilots to scaled systems, but selected leading sites are not representative of every manufacturer.[6]
Industrial AI earns expansion when its operating benefit survives normal production conditions and its economics survive the full cost calculation.
Download the illustrative financial model (CSV) ↗
Sources and scope.
- NVIDIA — Germany and industrial AI, October 19, 2026
- PepsiCo — Siemens and NVIDIA collaboration, January 6, 2026
- Siemens — P&G inspection rollout
- AWS — Georgia-Pacific / C3 AI customer case; publication date not stated
- BMW — Physical AI at Spartanburg, June 25, 2026
- World Economic Forum — Global Lighthouse Network, January 15, 2026
Independent desk analysis using public company, vendor and institutional materials. No plant visit, internal dataset, product test or independent audit was conducted. Reported outcomes have different baselines and scopes; they are not forecasts for another operation. Analytical frameworks and the hypothetical financial model are Jaguo Insights’ interpretation. No affiliation or endorsement is implied.